NFL Quarterback Drive Stats 2025: The Forgotten Value of Patrick Mahomes and Daniel Jones
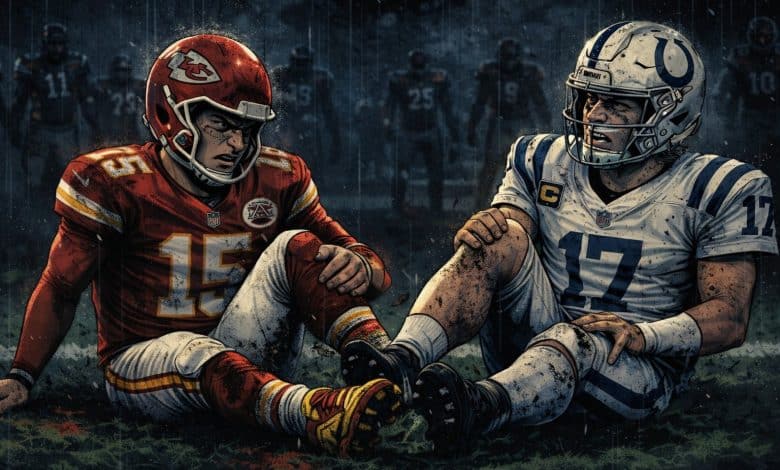
It was a strange 2025 NFL season at the quarterback position that can best be summarized by what happened to the Chiefs and Colts. When they met in a Week 12 game that went to overtime, those two offenses were as efficient as any in the league on a per-drive basis behind two MVP candidates in Daniel Jones and Patrick Mahomes.
But by season’s end, the Chiefs and Colts had losing records, missed the postseason, and Philip Rivers came out of a five-year retirement at age 44 to throw four touchdowns in a December that saw Jones tear his Achilles and Mahomes tear his ACL.
In the final stats for 2025, neither offense really stands out as the Colts were slumping from their historic pace halfway through the season once Jones started having leg injuries that affected his play leading up to his injury.
The Chiefs had a lot of issues offensively but were still near the top of the league in yards per drive all year behind a scrambling Mahomes, who eventually succumbed to the most serious injury of his career after playing behind two third-string tackles against the Texans and Chargers in consecutive weeks.
If only there was a way to better isolate the efficiency of an offense when a starting quarterback was active compared to when he was on the bench or injured. Fortunately, we have a simple tool for this even if the data is harder to compile than one would like to admit in 2026.
We’re looking at quarterback drive stats for the 2025 NFL season.
Table of Contents
What Are Drive Stats and Why Are They Important in the NFL?
The NFL is changing before our eyes in the last few years. Teams are going for it on fourth down more often, which is shrinking the number of possessions in a game since drives that would normally end with a punt or short field goal are being extended to feature more plays and touchdowns.
The only reason scoring isn’t jumping off the charts is because of the other factors that push back against this. Kickers are blasting 60+ yard field goals better than ever, so some of those teams with the big-leg kickers like the Cowboys (Brandon Aubrey) and Jaguars (Cam Little) don’t mind going for the longer kicks now.
The new kickoff system is also encouraging more returns and touchbacks that go to the 35-yard line, so the field is shrinking that way as well. Still, the 10.7 (2024) and 10.5 drives per game for a team the last two years are the lowest figures on record. Teams were averaging 12.0 drives per game in the 2013 season that saw Peyton Manning throw 55 touchdowns for the Broncos as well as the single-season yardage record that hasn’t been challenged yet despite a move to 17-game seasons.
We’ve also seen more of an emphasis from the good teams on running the ball the last few years even if some basic numbers don’t really show that change. For instance, teams averaged 26.8 rushes in 2025 compared to 27.3 in 2022, 26.9 in 2020 (COVID year with empty stadiums), and 27.1 in 2013. But it’s still true that passing yards per game were at their lowest since 2006 in the 2025 season at 209.7 yards per game.
The important thing to note is we are starting to see a greater variation of styles with some teams opting for a grinding run game to complement their defense, some playing a lot of four-down football, some still going shotgun/pass happy, and some spamming play-action passes for deep shots.
With all of these conflicting styles, we need some better stats to account for the difference in pace in NFL games. They may all be 60 minutes in regulation, but they can have a wide range of total possessions between the teams depending on the flow and style of the game that day.
The NBA has been using a simple advanced stat to deal with the variance in pace in that league. Net Rating is simply a team’s point differential per 100 possessions. You take the team’s Offensive Rating and subtract the Defensive Rating, which are just points scored (offense) and points allowed (defense) per 100 possessions. Easy enough.
This way, you don’t penalize a team that plays a faster pace of game for allowing a lot of points when their defense is actually still elite on a per-possession basis. The 2014-15 Warriors, the start of the dynasty led by Steph Curry, are the best example of why these stats matter. The Warriors that year ranked 15th in points per game allowed, which sounds mediocre, but since they played the fastest pace in the NBA that year, they were still No. 1 in Defensive Rating when you divide by 100 possessions. They were also 67-15 and won the NBA Finals.
In the NFL, we need drive stats to counter the issue of pace. A game that ends 20-17 between teams who only had the ball eight times each is actually a better offensive game than a game that ends 24-21 where each team had at least 14 possessions. Since you can only score once on a drive, teams that go on long scoring marches as most of the best offenses usually do should not be penalized.
Meanwhile, defenses that get a lot of stops should be rewarded statistically. If you give up 21 points on 13 drives, that’s a better job than a defense that gives up 17 points on 7 drives. One defense was just asked to do a lot more, facing an extra six drives likely because the offense wasn’t efficient enough that day.
Drive stats are not perfect, but no stat really is. They don’t adjust for field position, so giving up a 1-yard touchdown drive because of a turnover or special teams play is a cheap way for an offense to get a touchdown drive where the defense had little hope to stop them.
Drive stats don’t adjust for opponent, though that’s always hard to do anyway in the NFL because of injuries. You could have played the 2025 49ers in games where Nick Bosa and Fred Warner, their two best defenders, were active. A few weeks later, you would have played them when only Warner was active. A few weeks later (and for most of 2025), you would have played them with neither player, so that sure feels like three different versions of the 49ers, to say nothing of their other pieces going in and out of the lineup.

NFL drive stats have existed in some form on the internet since the 2000s. They were available at Football Outsiders, a site that no longer exists. Today, you can find drive stats at Pro Football Reference (PFR) for offense and defense under the “Drive Averages” portion of the main stat pages for a season.
The issue there is the numbers don’t remove kneeldown drives at the end of halves, which have some impact on the final numbers since about 3% of the drives in the 2025 season were just a team taking 1-3 knees to run out the clock without ever attempting a real play to gain yards. The FO numbers would remove those, though I’ve found some errors at both sites that made me rethink how much I want to trust those numbers at face value. Even on Stathead via PFR, there’s a handful of 2025 games where a touchdown drive (or two) is just flat out missing in the drive charts and Drive Finder.
I have manually tracked drive stats in different ways for over 20 years now, starting with comebacks and game-winning drives for quarterbacks. Yes, those are technically drive stats as a quarterback gets credit for leading a game-tying or game-winning drive based on the time left in the game and the score at the time. But it is a form of drive stats and the most commonly used drive stat in NFL media coverage. Another form that’s often used without being labeled as such is red zone touchdown rates. That’s a drive stat at its core.
But most drive stats have been at the team level for offense and defense. I wrote one of the first (and probably only) pieces at the old PFR blog (RIP) about playoff drive stats for select quarterbacks going back to the 1980s. That was so long ago (right before Super Bowl 45) that you have to use the Wayback Machine to access it today, but it’s still around.
That concept of creating drive stats based only on when the starting quarterback is in the game is something I’ve been wanting to build my own database for years for, but it is time-consuming work if you’re going to check things for accuracy like whether a drive was a kneeldown or a real attempt at offense.
But I started keeping track early in the 2025 season for each drive, and I finished things this week in good enough shape to present them today. I’d love to be able to go back to at least 2001 for this data for every season, but let’s just start with 2025.
I have long been an advocate for drive stats and think the data is very useful for analyzing NFL games/teams/players. One thing you basically never hear anyone say is “my team had 6,235 yards of offense this year” or “we’re averaging 387.3 yards per game on offense this year.” Those are clunky numbers. But if you break it down per drive to say “they’re averaging a league-best 40.0 yards per drive in 2026,” then that sounds more reasonable to use in the mainstream to get a point across.
But it starts with getting these numbers out there, making sure they’re correct, and getting people to understand what a good/bad/mediocre number is for things like points per drive and yards per drive.
But drive stats are robust and are used in ways already that people are comfortable with like game-winning drives and red zone touchdown rates. We just need to make it more widespread as breaking down drives is one of the best ways to analyze NFL games.
2025 NFL Quarterback Drive Stats
Let’s start looking at some drive stats for the 2025 NFL season (regular season only unless noted otherwise) with some caveats:
- This excludes kneeldown drives and those were only the drives that were all kneeldowns to end a half.
- The stats include all offensive plays whether or not the quarterback contributed or just handed off to a running back.
- The quarterback for each drive is based on the quarterback that starts the drive, not the one who finishes it.
- I figured 85 drives would be a decent minimum requirement (5 drives per 17 team games) to make the leaderboard, and it just so happens 32 quarterbacks had at least 85 non-kneeldown drives in 2025.
But that doesn’t mean every team is featured, and I may tweak this down the road based on further research. But I’d likely never go below 70 drives to qualify for leaderboards.
The following table is going to have four key drive stats for an offense:
- Yds/Dr: Net yards per drive (includes penalty yards)
- Pts/Dr: Points per drive (6 points per touchdown + whatever the actual XP/2PC outcome was that drive)
- Time/Dr: Time of possession per drive
- LOS/Dr: Average starting field position (higher number = shorter field to conquer)
Here are the 32 qualified quarterbacks for 2025 drive stats (min. 85 drives), sorted by descending yards per drive:
| QB | Team | Drives | Yds/Dr | Rk | Pts/Dr | Rk | Time/Dr | Rk | LOS/Dr | Rk |
|---|---|---|---|---|---|---|---|---|---|---|
| Dak Prescott | DAL | 162 | 40.14 | 1 | 2.71 | 6 | 3:04 | 10 | 28.19 | 30 |
| Daniel Jones | IND | 116 | 39.63 | 2 | 3.08 | 1 | 3:02 | 11 | 31.26 | 9 |
| Drake Maye | NE | 158 | 39.54 | 3 | 2.87 | 4 | 3:11 | 7 | 30.50 | 17 |
| Patrick Mahomes | KC | 127 | 39.24 | 4 | 2.58 | 9 | 3:20 | 3 | 27.94 | 31 |
| Josh Allen | BUF | 154 | 39.08 | 5 | 2.81 | 5 | 3:20 | 2 | 29.57 | 23 |
| Matthew Stafford | LAR | 172 | 39.05 | 6 | 2.93 | 2 | 2:58 | 15 | 31.95 | 7 |
| Jordan Love | GB | 133 | 37.80 | 7 | 2.66 | 7 | 3:16 | 4 | 29.74 | 21 |
| Brock Purdy | SF | 86 | 37.50 | 8 | 2.88 | 3 | 3:13 | 5 | 33.19 | 1 |
| Jared Goff | DET | 178 | 34.53 | 9 | 2.63 | 8 | 2:51 | 24 | 32.27 | 4 |
| Sam Darnold | SEA | 171 | 34.41 | 10 | 2.53 | 10 | 2:49 | 25 | 30.51 | 16 |
| Justin Herbert | LAC | 157 | 34.27 | 11 | 2.31 | 15 | 3:20 | 1 | 29.84 | 20 |
| Michael Penix Jr. | ATL | 86 | 34.06 | 12 | 2.08 | 22 | 2:58 | 13 | 28.76 | 28 |
| Caleb Williams | CHI | 174 | 34.03 | 13 | 2.45 | 12 | 2:58 | 14 | 32.20 | 5 |
| Jaxson Dart | NYG | 114 | 33.96 | 14 | 2.35 | 14 | 3:06 | 8 | 32.97 | 2 |
| Jacoby Brissett | ARI | 119 | 33.28 | 15 | 2.06 | 23 | 2:55 | 20 | 29.95 | 19 |
| Baker Mayfield | TB | 169 | 32.40 | 16 | 2.15 | 18 | 3:06 | 9 | 30.46 | 18 |
| Lamar Jackson | BAL | 126 | 32.40 | 17 | 2.42 | 13 | 2:40 | 31 | 31.13 | 10 |
| Tyler Shough | NO | 94 | 32.33 | 18 | 1.74 | 29 | 2:54 | 21 | 29.49 | 24 |
| Bo Nix | DEN | 178 | 31.94 | 19 | 2.17 | 17 | 2:56 | 17 | 29.03 | 26 |
| Trevor Lawrence | JAX | 177 | 31.83 | 20 | 2.50 | 11 | 2:57 | 16 | 32.62 | 3 |
| Joe Flacco | 2TM | 105 | 31.42 | 21 | 1.89 | 26 | 2:51 | 23 | 28.46 | 29 |
| Bryce Young | CAR | 144 | 31.37 | 22 | 1.95 | 25 | 3:11 | 6 | 30.67 | 14 |
| Aaron Rodgers | PIT | 153 | 30.80 | 23 | 2.24 | 16 | 2:48 | 26 | 31.99 | 6 |
| Tua Tagovailoa | MIA | 133 | 30.72 | 24 | 2.14 | 20 | 2:56 | 18 | 30.71 | 13 |
| C.J. Stroud | HOU | 135 | 30.54 | 25 | 2.14 | 19 | 3:02 | 12 | 31.76 | 8 |
| Kirk Cousins | ATL | 89 | 29.97 | 26 | 1.88 | 27 | 2:47 | 28 | 30.88 | 12 |
| Jalen Hurts | PHI | 161 | 29.73 | 27 | 2.12 | 21 | 2:55 | 19 | 28.95 | 27 |
| J.J. McCarthy | MIN | 94 | 27.43 | 28 | 2.05 | 24 | 2:41 | 30 | 30.56 | 15 |
| Justin Fields | NYJ | 85 | 26.75 | 29 | 1.84 | 28 | 2:51 | 22 | 29.69 | 22 |
| Geno Smith | LV | 149 | 24.93 | 30 | 1.46 | 31 | 2:47 | 27 | 29.48 | 25 |
| Cam Ward | TEN | 171 | 24.09 | 31 | 1.49 | 30 | 2:45 | 29 | 31.01 | 11 |
| Shedeur Sanders | CLE | 85 | 22.14 | 32 | 1.21 | 32 | 2:27 | 32 | 27.80 | 32 |
One of the main reasons I’ve always liked these stats is that the cream rises to the top most of the time. Even when you’re factoring in the running game success on top of the quarterback’s production, the best quarterbacks usually have the best rankings, on average, in both yards and points per drive.
It’s no surprise you see a tight cluster in the top six between 39-40 yards with the MVP candidates (Matthew Stafford and Drake Maye), the consensus top two in the game over time (Patrick Mahomes and Josh Allen), a big year for Dak Prescott on top, and that magical start for Daniel Jones in Indy. Jones was the only one to finish above 3.0 points per drive, and MVP Stafford was the best for a full-season starter at 2.93 Pts/Dr.
You can also see once you get to the bottom eight or so, the quarterbacks struggling to stay above 30.0 yards per drive, that you run into players who are in talks to be benched, have been benched, or their teams are already moving in a different direction for 2026.
Then you see the rookies at the bottom in Cam Ward and Shedeur Sanders, though Ward had that brutal schedule of defenses as we looked at recently.
Interesting to note that Allen, Mahomes, and Justin Herbert all had an average possession of time of 3:20, the longest in 2025. Great quarterbacks typically don’t go three-and-out, extend drives on third down, and do well in this stat.
An elite player who had a down year with injuries was Lamar Jackson in Baltimore as his mediocre yardage paired with the second-shortest drive times speak to his penchant for taking sacks in 2025 and the struggles he had for a month after returning from injury the first time.
Brock Purdy had the best average starting field position for the 49ers at the 33.19, so combine that with the lack of strong defenses he faced upon his return before getting crushed by the Seahawks twice, and you can kind of see how the 49ers survived to 12 wins this year despite the injuries.
Shedeur Sanders had the worst average field position (27.8) with Mahomes not far behind, another factor in Kansas City’s disappointing losing season. Seemingly anytime they had a decent kick return it was going to get called back for a penalty.
Another drive stat result is three-and-out rate (3AO%), measuring the rate of drives where an offense runs three plays, gains no first downs, and punts. The Eagles led the NFL in that stat in 2025, but Jalen Hurts (30.4% 3AO%) just ranked ahead of Shedeur Sanders (30.6%), who didn’t start as many games. The next closest-player was Justin Fields on the Jets (27.1%), so that’s not good company for Hurts, who will have a new offensive coordinator in 2026
Who had the lowest 3AO rates? That’d be Dak Prescott (13.0%), Bryce Young (13.9%), Brock Purdy (14.0%), Daniel Jones (15.5%), Matthew Stafford (15.7%), and Drake Maye (16.5%).
New England’s Drake Maye was the ultimate bridesmaid in 2025, a runner-up for MVP and in the Super Bowl. Not too shabby at all for a second-year passer, but the schedule criticisms were always valid, and we’ll see how that plays out for him in 2026 against what should be a tougher slate. If you compare the Maye drive stats in the regular season and playoffs, it’s hard to find a bigger decline than this once he started playing top defenses/teams:
- Maye in regular season: 158 drives, 39.54 Yds/Dr, 2.87 Pts/Dr, 3:11 Time/Dr, 30.50 LOS, 16.5% 3AO%
- Maye in the playoffs: 51 drives, 23.25 Yds/Dr, 1.18 Pts/Dr, 2:24 Time/Dr, 28.29 LOS, 31.4% 3AO%
Yikes. The Patriots turned into the worst offense in the NFL in the playoffs based on those numbers.
Finally, Sam Darnold comes out looking fine here after finishing 10th in the regular season in both yards and points per drive. Not bad for an offense that rarely had long touchdown drives after October. But in the playoffs, Darnold’s 30 drives produced 33.37 Yds/Dr and 2.90 Pts/Dr with some elite field position (35.50 LOS/Dr).
NFL 2025 Drive Stats: Value Between Starters and Backups

I thought we’d wrap things up looking at the value in drive stats to show the difference between most starters and backups since quarterback injuries are so prevalent in some NFL seasons like they undoubtedly were in 2025.
When I tweeted this picture showing the drop-off between a team’s primary starter (QB1) and the others (the backups), I accidentally forgot to remove the kneeldowns, so those numbers aren’t as useful as I’d like.
I’ll also note that picking every team’s primary QB was not the easiest task as it’s hard to say who the Browns and Jets valued that player to be in 2025, but I used Shedeur Sanders and Justin Fields for them.
So, once you remove kneeldowns, there were teams who had almost no full drives led by their backup quarterback. For example, players like Bo Nix (1), Matthew Stafford (2), Caleb Williams (2), Jared Goff (4), and Trevor Lawrence (4) handled all but a handful of their team’s drives in the regular season. Sadly, you know it’s regular season when the Bo Nix number is a single drive. Jarrett Stidham had to play the entire AFC Championship Game after Nix broke his ankle.
Remember when we started things here talking about the forgotten value of Mahomes and Jones in 2025? At the end of the day, there were 17 teams who had a backup start at least 20 drives in the 2025 season. Mahomes (+26.4 in yards, +1.69 in points per drive) and Jones (+13.2 in yards, +1.12 in points per drive) easily had the biggest impact over their backups in that group of 17 teams:

On 38 drives without Patrick Mahomes in the final three games, against two of the worst teams (Titans, Raiders) in the NFL, the Chiefs averaged just 12.84 Yds/Dr and 0.89 Pts/Dr. Andy Reid, what happened to your offensive wizardry?
Only three quarterbacks (Kyler Murray, Shedeur Sanders, Jayden Daniels) averaged fewer points per drive than their backups did, so good look on Jacoby Brissett in Arizona, and that’s probably why Murray won’t be there in 2026. Hopefully Daniels can get healthy and 2025 was just an outlier instead of his rookie year being the fluke.
All things told, here are the final 2025 numbers (playoffs included) for drives with the primary quarterback vs. all other quarterbacks:
- Primary: 4,492 Drives, 33.06 Yds/Dr, 2.30 Pts/Dr, 2:59 Time/Dr, 30.56 LOS/Dr, 20.4% 3AO%
- Others: 1,320 Drives, 28.00 Yds/Dr, 1.68 Pts/Dr, 2:47 Time/Dr, 30.65 LOS/Dr, 22.0% 3AO%
Again, we can debate over some of the primary quarterbacks being worse players than the backups, but that’s roughly a difference of 5.0 yards and 0.6 points per every drive for the primary quarterback.
How does that compare to past seasons? Hopefully I can answer that soon enough. But for now, this is a good start on quarterback-specific drive stats.
Related Articles:
- The Best to Never Do It: The Precedent Behind Josh Allen, Connor McDavid, Luka Doncic, and Aaron Judge Having Zero Championships in 2026
- Ranking the 36 Super Bowl-Winning Quarterbacks into Tiers: Where Does Sam Darnold Fit?
- Predicting the NFL Starting Quarterbacks for the 2026 Season
- After a Close NFL 2025 MVP Vote, What Do People Even Value in a Quarterback These Days?
- Lessons from the 2025 NFL Season, 2026 Storylines, and the Early Super Bowl 61 Odds
- Sam Darnold, the Patriots, and the Curse of MetLife Stadium (A Super Bowl 60 Story)
- The Worst Super Bowl Teams in NFL History: Are the 2025 Patriots in the Mix?
- 2025 Final NFL Quarterback Rankings: Matthew Stafford Is the MVP
- Patrick Mahomes Turns 30: The Best There Is, the Best There Was, the Best There Ever Will Be?
- 2025 NFL Award Nominees and Best Bets: Can We Get a Good and Logical MVP Race?